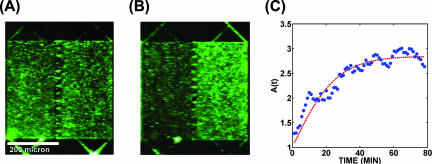
FIG. 2.
Distribution of bacteria in a structure with a funnel wall. (A) Uniform distribution after injection. (B) Steady-state distribution after 80 min. (C) Ratios of densities in the left and right compartments versus time. The blue circles are experimental data, and the dashed red line is a fit of equation A2 from the Appendix.

