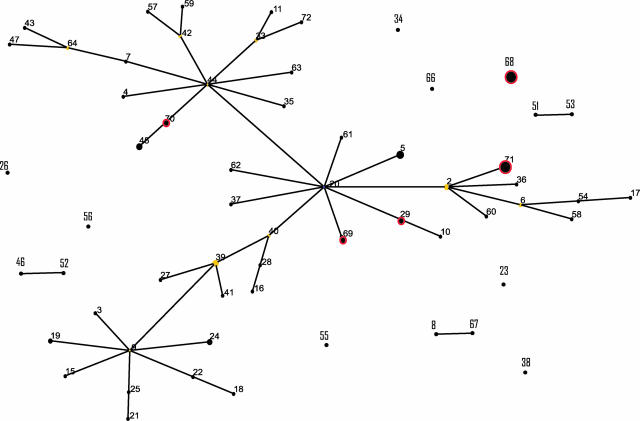
FIG. 2.
Schematic diagram of the clonal relatedness of S. pseudintermedius STs predicted by eBURST analysis. Each ST is represented by a black dot, the size of which is proportional to the number of isolates of that ST. Blue and yellow dots denote the predicted group founder and subgroup founders, respectively. Single-locus variants are linked by lines. STs that include MRSP strains are indicated by red circles. STs that are not linked by branches to other STs do not share at least four identical alleles with any other ST.

