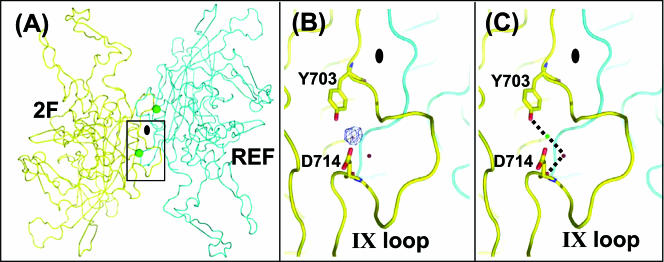
FIG. 7.
Putative AAV8 ion binding site. (A) Overall view of the cation binding site close to the icosahedral twofold axis region. The cation binding site is depicted as a green sphere. The reference VP monomer is shown in cyan, and the twofold symmetry-related monomer is shown in yellow. The approximate twofold axis is shown as a filled oval. (B) Fo-Fc electron density map of native crystals (blue mesh). The view is a zoomed-in version of the boxed region in panel A. The map was generated using the CNS program (7) and is shown at a 4σ contour level. The typical density for a solvent molecule (in red) contoured at 4σ is shown for comparison. (C) The environment of the cation binding site. The view is the same as that for panel B. Residues making hydrogen bonds (dotted lines) with the cation (green sphere), i.e., Y703 and D714, and a solvent molecule (red sphere) are shown.

