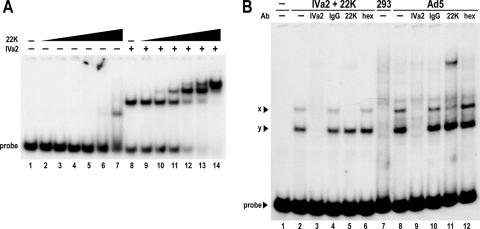
FIG. 2.
Interaction of the 22-kDa and IVa2 proteins with the A1-A2 probe. (A) Autoradiogram from EMSA comparing binding of the 22-kDa (22K) protein to the A1-A2 probe in the presence (+) or absence (−) of a 10 nM concentration of the IVa2 protein (IVa2). The dash above the first lane of each set indicates that the reaction contains no 22-kDa protein. Triangles above the subsequent lanes represent increasing concentrations of the 22-kDa protein (0.1, 0.3, 1.6, 8, 40, and 200 nM). (B) Supershift analysis. The labeled bold lines above the lanes indicate proteins or nuclear extracts added to reactions as follows: −, no protein; IVa2 + 22K, 50 nM IVa2 and 1.6 nM 22-kDa protein; 293, 4 μg mock-infected 293 nuclear extract; Ad5, 4 μg Ad5-infected 293 nuclear extract. The antibodies incubated in each reaction are indicated below the bold lines: −, no antibodies; IVa2, purified anti-IVa2 peptide rabbit IgG; IgG, purified preimmune rabbit IgG; 22K, anti-22-kDa hybridoma supernatant; hex, anti-hexon hybridoma supernatant. The x and y complexes are indicated with labeled arrowheads.

