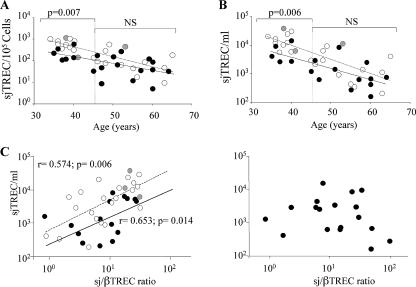
FIG. 2.
Consequences of the increased thymic function on peripheral RTE population. (A) Relationships between the sjTREC frequency and age in HIV-2-infected patients and healthy control individuals. (B) Relationships between sjTREC concentration and age in HIV-2-infected patients and healthy control individuals. In both panels A and B, the white symbols and dashed lines represent healthy controls (gray dots represent healthy controls of African origin), and the black symbols and solid lines represent the HIV-2-infected patients. The P values from the statistical analysis (Mann-Whitney test) for each age group are shown above the values. NS, not significant. (C) Relationships between the sjTREC concentration and thymic function in healthy controls (white and gray symbols, representing Caucasian and African individuals, respectively), HIV-1-infected patients (left graph, black symbols), and HIV-2-infected patients (right graph). When significant, P values from the statistical analysis are shown (Spearman's correlation and associated probability).

