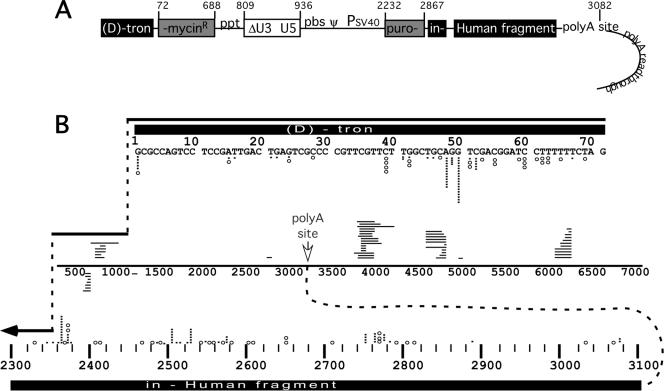
FIG. 6.
Spectra of donor departure and acceptor entry sites observed in analyzed clonal products. (A) Schematic representation of humanTM vector, including polyadenylation readthrough region. Numbers at top indicate map positions on the RNA and indicate that the schematic is not to scale. Note that polyadenylation signal readthrough resulted in the appendage of RNA copies of plasmid backbone sequences to a subset of the vector RNAs' 3′ ends. (B) Compendium of donor departure and acceptor entry sites for all 83 nonhomologous recombination products. Diagrammed as in Fig. 5C. Each open circle indicates a simple recombination donor departure or acceptor entry site; each black bar indicates a corresponding site for a complex recombinant. Acceptor sites for 20-base intervals are binned; stacked circles and/or bars indicate multiple entries into a single acceptor site within the interval. The RNA strand drawn in the center of Fig. 6B represents splinting templates. Crossover site locations for those recombinants that used sequences on the same or copackaged vector RNA are shown. Horizontal lines above the splinting template indicate the locations of splinting RNA template segments; lines below indicate splinting DNA templates. Each horizontal line represents a separate tertiary template segment. Each encompasses the template segments used, but these are not precisely to scale. polyA site, polyadenylation site. Acceptor region abbreviations are given in the legend to Fig. 1.

