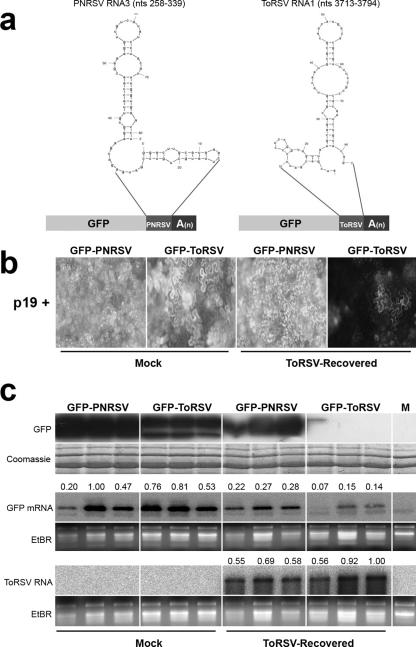
FIG. 5.
ToRSV does not prevent assembly and/or affect the activity of RISCs. (a) Design of sensor constructs. Fragments (81 nt long) from PNRSV RNA 3 or ToRSV RNA 1 were fused in frame to the 3′ end of the GFP coding sequence and expressed under the control of the 35S promoter. The putative secondary structures of the fragments (as predicted by the Mfold program) are shown. (b) Relative fluorescence obtained after expression of sensor constructs in mock-inoculated or ToRSV-recovered leaves 5 days after agroinfiltration. (c) Comparative analysis of the concentrations of GFP (top), GFP mRNA (middle), and ToRSV RNA (bottom) in mock-inoculated or ToRSV-recovered plants 5 days after agroinfiltration. For detection of GFP mRNA and ToRSV RNA, a full-length GFP cDNA (amplified with primers p18F [5′-ATGAGTAAAGGAGAAGAACT] and p19R [5′-CAAACTCAAGAAGGACCATG]) and the ToRSV CP open reading frame (amplified with primers p52F [5′-GTCTCTAGATGGGGCGGGTCCTGGCAAGAAGG] and p51R [described in the legend to Fig. 2]) were used as probes, respectively. For relative quantification of band intensities, digital light units were measured from each lane from both EtBr-stained gel pictures and phosphorimages from Northern blots, using OptiQuant 5.0 software (Perkin-Elmer). The relative RNA concentration was corrected using the following formula: values from the blots (intensities of RNA signals)/values from the EtBr-stained gel pictures (amounts of RNA loaded). The results were divided by the maximum value so that the relative concentrations of RNA are presented on a scale of 0 to 1 (shown above each lane of the GFP mRNA and ToRSV RNA Northern blots).

