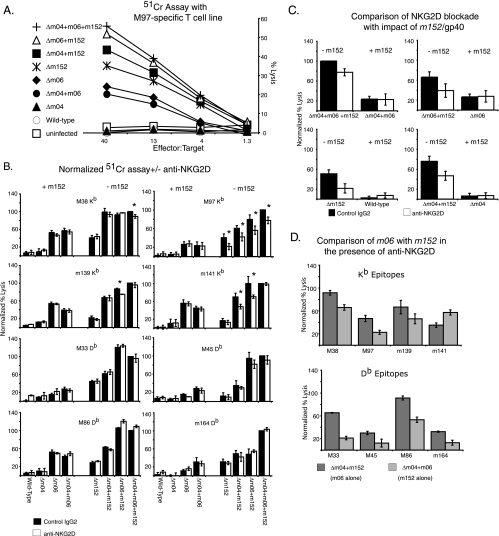
FIG. 4.
The impact of the inhibition of NKG2D on CD8 T-cell killing in the presence and absence of m152. (A) Representative 51Cr release assay in the presence of 50 μg/ml of anti-NKG2D. (B) CTL lysis in the presence of anti-NKG2D (open bars) or control IgG (solid bars). +m152 and −m152 indicate the expression of m152 in the viruses used in each group. At least three 51Cr assays were completed for each epitope, and the results normalized by expressing the lysis of each data point as a percentage of the lysis of Δm4 m6 m152 with control IgG. The means ± standard errors of the means of the normalized results from at least three assays per group using an E/T ratio that was off the maximal plateau are shown. A significant difference (P < 0.05) between lysis in the presence and absence of NKG2D blockade is indicated by an asterisk. (C) Direct comparison of the impacts of m152/gp40 and NKG2D blockade on cytolysis by M97-specific T cells. The data shown in panel B are regraphed to compare virus pairs that differ only by the absence or presence of m152 with and without NKG2D blockade. Error bars show the means ± standard errors of the means. (D) Comparison of the effects of m152/gp40 or m06/gp48 alone in the presence of anti-NKG2D. The data shown in panel B are regraphed to compare the impacts of m152/gp40 and m06/gp48 when NKG2D inhibition is playing no role. Error bars show the means ± standard errors of the means.

