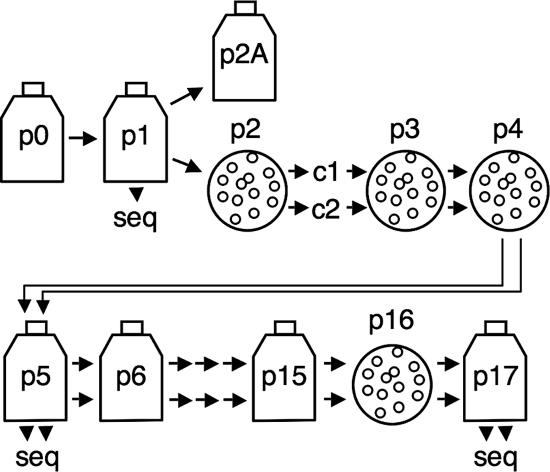
FIG. 3.
Virus isolation and passage strategy. Flasks indicate population passage, and circles indicate plaque isolation. From p2 forward, two plaque clones were isolated and passed in parallel, indicated by double arrows. Passages where RNA from infected cells was purified and used for RT-PCR and determination of viral sequences are denoted by seq. Passages between p0 and p6 were conducted at an MOI of ≤0.1 PFU/cell. Passages between p6 and 15 were performed at unknown MOIs.

