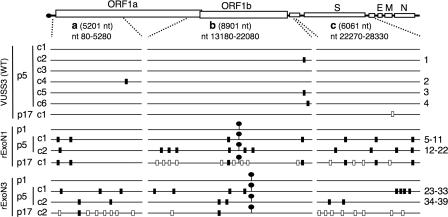
FIG. 5.
Distribution of mutations in WT, rExoN1, and rExoN3 mutants. Schematic of MHV RNA genome shows the regions a, b, and c that were amplified by RT-PCR and sequenced for each WT and ExoN mutant virus. The 5′ and 3′ terminal nucleotides of the regions are indicated, as is the length in nucleotides. Lollipops indicate locations of engineered ExoN mutations. Black rectangles on each genome indicate additional mutations identified in p5 viruses. White rectangles indicate mutations identified in p17 but not in p5 viruses. Numbers at right indicate mutations for which details are shown in Table 3. VUSS3p17c1, rExoN1p17c1, and rExoN3p17c2 were derived from VUSS3p5c1, rExoN1p5c1, and rExoN3p5c2, respectively. S, spike; E, envelope; M, membrane; N, nucleocapsid protein.

