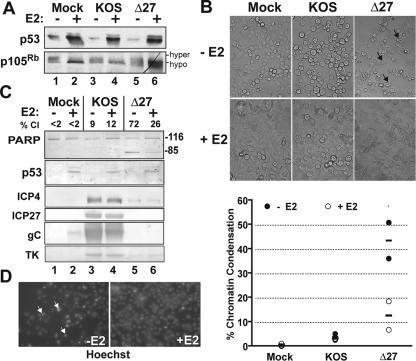
FIG. 2.
E2 suppresses HDAP in HeLa cells. At 48 h postinfection with (+) or without (−) E2-expressing recombinant virus SV40/BPV-1 (MOI of 20), Sen2 cells were infected with HSV-1(KOS) or vBSΔ27 (Δ27) (MOI of 10). (A) Cellular tumor suppressors following E2 expression. Lysates from infected cells were immunoblotted for p53 and p105Rb. Hypophosphorylation (hypo) and hyperphosphorylation (hyper) states of p105Rb are indicated. (B) Cellular morphologies. Cells were visualized at 24 h following infection with KOS or Δ27 viruses. Black arrows denote examples of cells displaying membrane blebbing. Image magnification, ×40. (C) Immunoblots of death factor PARP, viral proteins (ICP4, ICP27, gC, and TK), and cell cycle regulatory protein p53. The positions of uncleaved 116,000-molecular-weight (116) and cleaved 85,000-molecular-weight (85) PARP products are indicated to the right of the blot. The percentage of PARP cleavage (% Cl) was calculated using NIH Image analysis as described in Materials and Methods. (D) Chromatin condensation. Representative fluorescent images (×40 magnification) of Hoechst-stained nuclei from Sen2 cells infected with vBSΔ27 in the presence (+E2) and absence (−E2) of SV40/BPV-1 transduction are shown beside the graph. White arrows denote examples of nuclei with condensed chromatin. The percentages of condensed chromatin from duplicate experiments were calculated as described in Materials and Methods. The mean (bar) and end points of the range (circles) are plotted.

