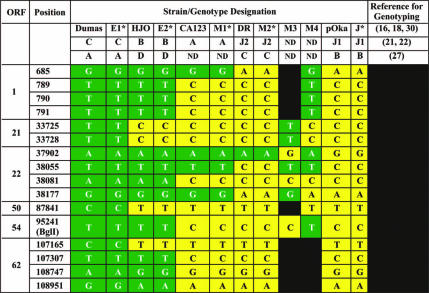
TABLE 3.
Analysis of genomic variation using data from multiple VZV ORFs for VZV reference strains and clinical specimens isolated in Australia and New Zealanda
Genotypes were derived using the two-amplicon protocol introduced in this report. All clinical specimens from Australia and New Zealand allocated to the E1, E2, M1, M2, and J genotypes (Table 2) had the corresponding array of SNPs displayed in this table at ORFs 21, 22, and 50. Green cells represent the E1 (Dumas) strain marker, yellow cells represent the J (pOka) strain marker, and black indicates that the marker has not been determined for that strain. ND, not discriminated.

