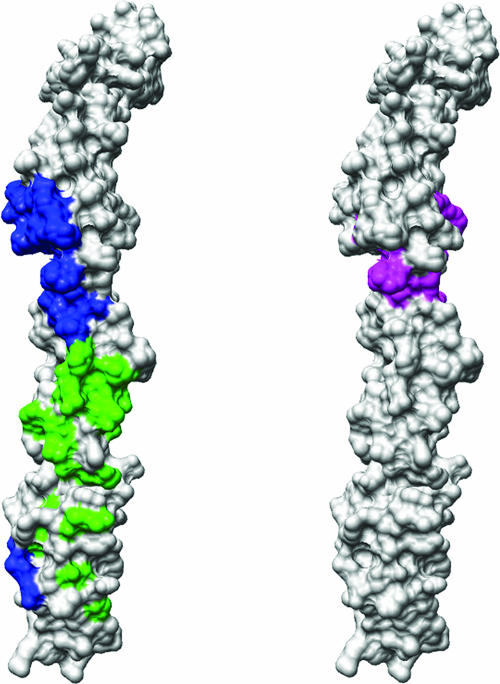
FIG. 7.
A surface rendering of the full-length fitted DAF structure, in stereo. (Left) The CVB3 footprint onto DAF (blue) compared to the EV12 footprint onto DAF (green) shows no overlap. (Right) The DAF area predicted to interact with convertases (from reference 20) (magenta) shows no overlap with the echovirus footprint on DAF and a slight overlap of five residues with the CVB3-RD footprint.

