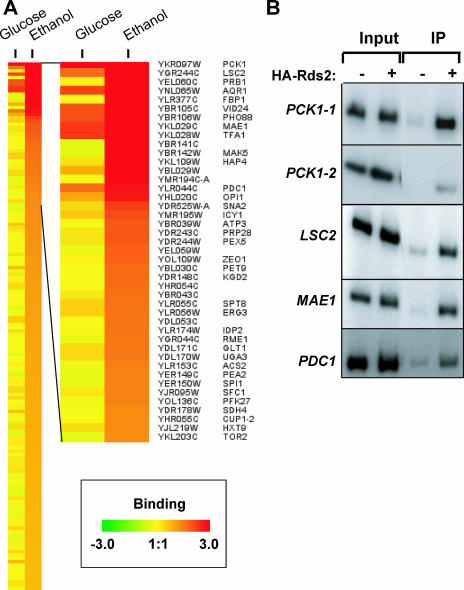
FIG. 1.
(A) Promoters bound by Rds2 with cells grown in the presence of glucose or ethanol. The enlarged view shown on the right depicts genes bound by Rds2, including systematic ORF names and gene names (when available). Rds2 bound all depicted promoters with a P value of <0.005 under glucose and/or ethanol conditions. (B) Confirmation of ChIP-chip results by standard ChIP analysis of selected genes. Experiments were performed with untagged (−) or HA-tagged (+) Rds2. Signals obtained with either input DNA (Input) or immunoprecipitated DNA (IP) are shown. For the PCK1 gene, two overlapping regions of its promoter were analyzed. The PCK1-1 pair of oligonucleotides targets the promoter region located between −449 and −117 bp, while the PCK1-2 pair targets the segment −605 to −351 bp (the coordinates are relative to ATG). The negative control GND1 (which is not bound by Rds2) did not give any enrichment (data not shown). ChIP analysis was performed as described in Materials and Methods.

