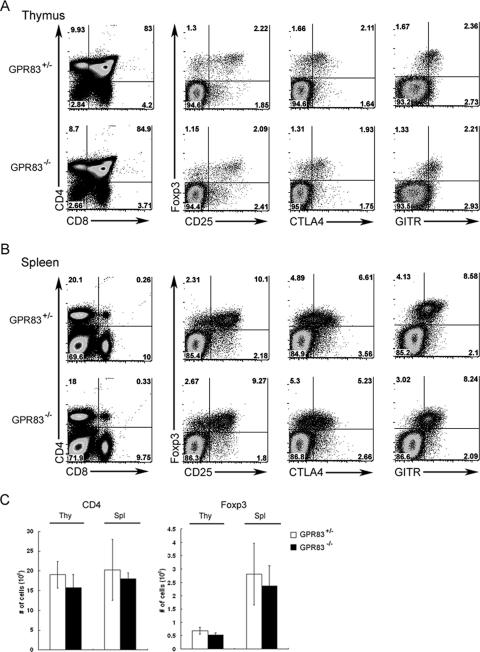
FIG. 2.
Phenotypic analysis of CD4 and CD8 T-cell subsets and surface phenotype of Treg cells in GPR83-deficient mice. (A and B) Flow cytometric analysis of CD4 and CD8 cell subsets in the thymus (A) and spleen (B). Foxp3, CD25, cytotoxic-T-lymphocyte antigen 4 (CTLA4), and glucocorticoid-induced tumor necrosis factor receptor (GITR) expression by thymic CD4 single-positive thymocytes (A) or splenic CD4 T cells (B) was analyzed by flow cytometry. Representative data are shown. More than five animals in each group were analyzed in three independent experiments. (C) Numbers of CD4 single-positive cells in thymus tissue (thy) and of CD4+ T cells in spleen tissue (spl) as well as numbers of CD4+ Foxp3+ Treg cells in both thymus and spleen tissues are indicated. The data are presented as means ± standard deviations (SD).

