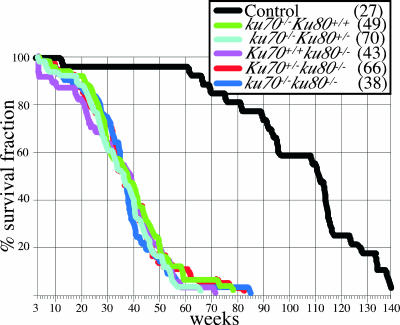
FIG. 1.
Life span analysis. Survival curves (100% × number of mice alive after each week/total number of mice at 3 weeks) are shown. Mice in the first 3 weeks were not included since Ku mutant mice often die before weaning because they are unable to compete with their littermates. Which line colors represent which mouse strains is shown in the inset (numbers of mice observed are in parentheses).

