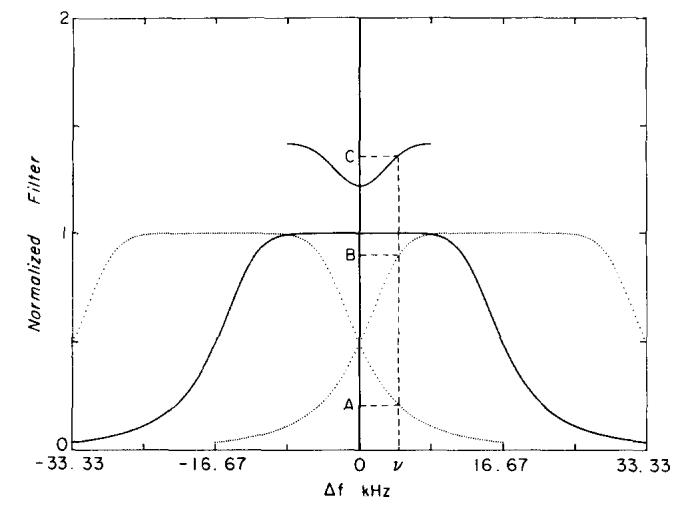
Fig. 7.

The frequency response of a 14-kHz filter used to band limit the received signal is shown as the lower solid line. The first two periods of the frequency response shown as dotted lines are centered at the frequencies ± 16.7 kHz (Nyquist = 8.33 kHz). The top solid line shows the RMSD calculated across the width of the image including aliasing of noise from these two repeated transforms. Independent noise is added in quadrature; therefore, C2 = 1 + A2 + B2.
