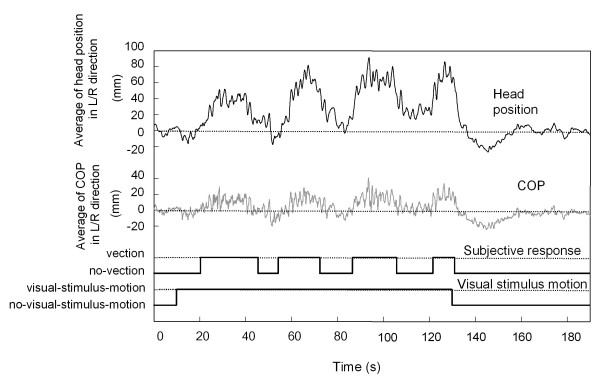
Figure 3.
Sample data for head position, COP, and vection responses in a typical trial. The data labeled as motion indicates the period of visual-stimulus-motion, while the data labeled as no-motion indicates the periods of no-visual-stimulus-motion. The positive vertical values indicate that head position and COP changes were in the direction of the visual-stimulus-motion. The value zero in the ordinate represents the average value during no-visual-stimulus-motion, prior to any visual-stimulus-motion.

