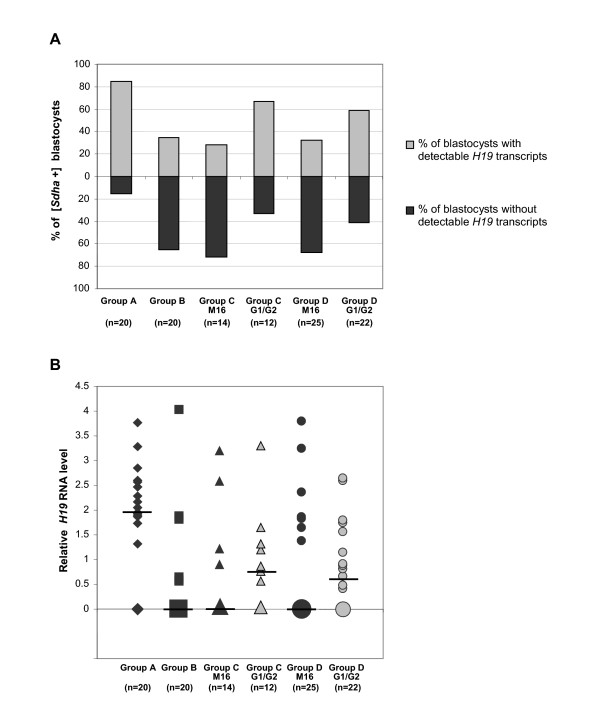
Figure 10.
H19 gene expression patterns in individual blastocysts according to experimental groups. H19 expression was determined by real time quantitative RT-PCR and calculated taking into account expression of a housekeeping gene (Sdha) and an internal standard sample. The results are presented as proportion of blastocysts with or without detectable H19 transcripts in Sdha expressing blastocysts (Figure 10A). The relative H19 RNA level is expressed according to the equation: H19 RNA quantity = 2 -ΔΔCt with ΔΔCt = (Ct(H19)-Ct(Sdha)sample - Ct(H19)-Ct(Sdha)standard). For each group, individual blastocyst expression is represented. The bars indicate the median expression value. The size of symbols is proportional to blastocyst number with the same H19 expression (Figure 10B).

