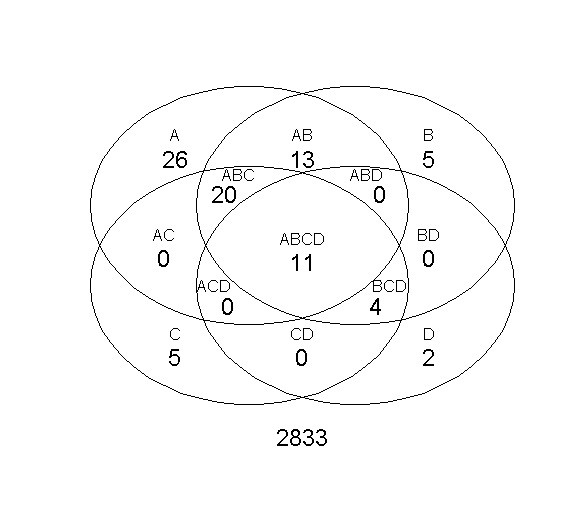
Figure 2.

Venn diagram of over-represented terms. The Venn diagram shows the number of GO terms considered significantly over-represented (p-value ≤ 0.01) by the Fisher Exact Test using four different probability cutoffs ℙ (genei is periodic) ≥ A, B, C or D ⇒ periodic: A = 0.70, B = 0.95, C = 0.99 and D = 0.9999.
