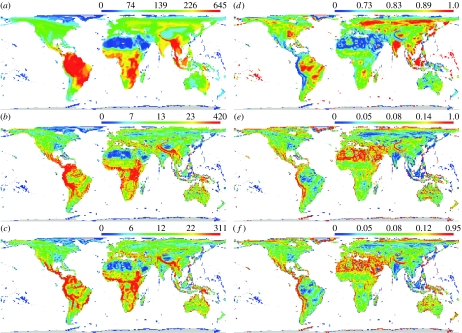
Figure 1.
Global distributions of species gain and loss between neighbouring grid cells. The mean number of species (a,d) shared (matching component a), (b,e) gained (matching component b) and (c,f) lost (matching component c) in comparisons between each focal grid cell and its adjacent neighbours, expressed as raw numbers (a–c) and as a proportion of the total number of species in the focal cell. The colour scales are histogram equalized and the quartile values are indicated.

