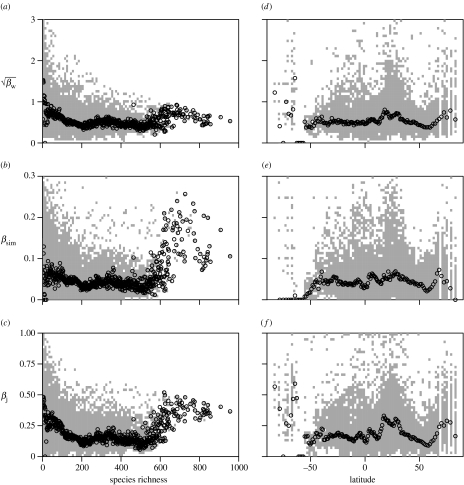
Figure 3.
Relationships of three indices of spatial turnover with species richness and latitude. Associations are shown for species richness (a–c), and latitude (d–f), for (a,d) square-root transformed βw, (b,e) βsim and (c,f) βj. The range of values at each latitude and species richness, respectively, is shown in grey and the latitudinal or species richness medians are plotted as open circles. In order to show these relationships more clearly, the graph for βw is truncated at 3 and that of βsim at 0.3.The omitted values constitute 1.8% (βw) and 0.7% (βsim) of the dataset: all have low species richness (max=186, median=4) but cover a wide range of latitudes. Southern latitudes are indicated as negative, northern ones as positive.

