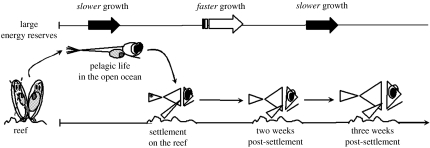
Figure 4.
Growth trajectory of a young fish from embryonic conditions in benthic nests, through pelagic life in the open ocean, to settlement and subsequent survival back on reef habitats. The arrows at the top of the diagram indicate the optimal growth rate at a given stage (e.g. at settlement on the reef) to ensure survival into a subsequent stage (e.g. at two weeks post-settlement). The black arrows indicate slower growth and the white arrow illustrates faster growth.

