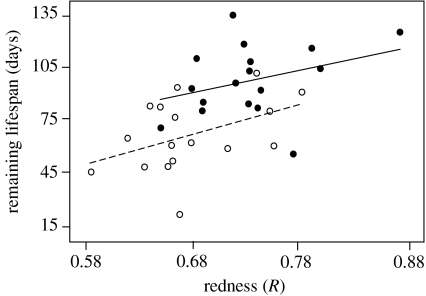
Figure 3.
The relationship between signal redness and remaining lifespan for males on the high- (filled circles and solid line) and low- (open circles and dashed line) carotenoid diets. Lines of least squares are shown for each diet treatment group (high carotenoids: r2=0.14; low carotenoids: r2=0.18; see text for details).

