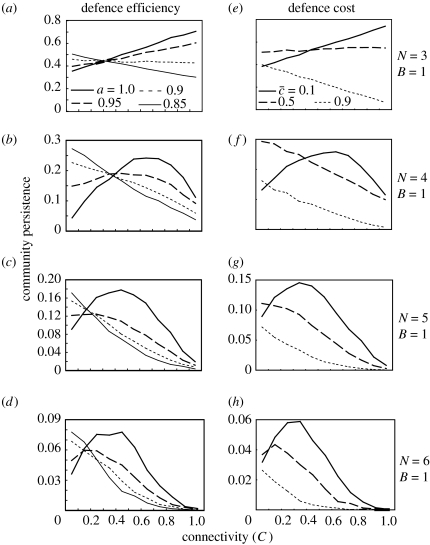
Figure 3.
The complexity–persistence relationship of a cascade food web consisting of adaptive prey with different defence efficiencies (a–d; a=1.0, 0.95, 0.9, 0.85) and defence costs (e–h; =0.1, 0.5, 0.9). The other parameters are G=0.25, F=1.0, si=1, e=0.15, m=0.001–0.01, N=3–6, B=1, a=1, =0. The result is qualitatively the same for the random model.

