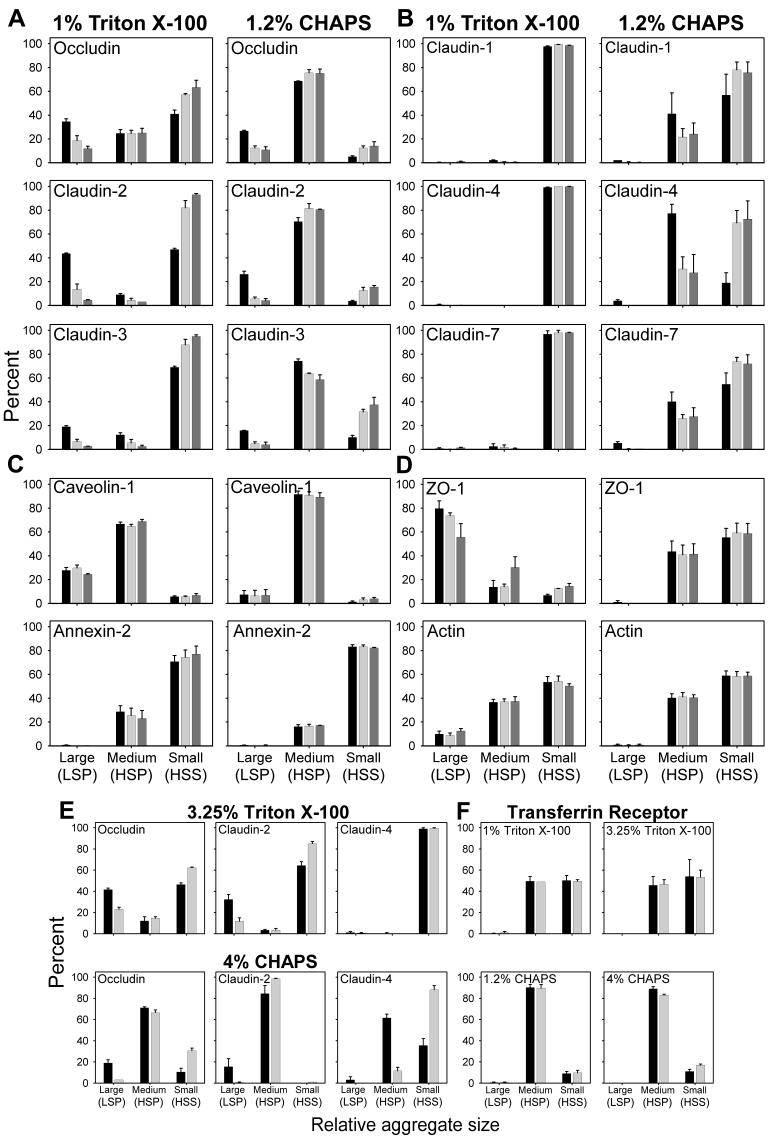
Figure 2.
Densitometric data derived from control MDCK II cells (black bar), treated for 30 min (light gray bars) or 2 h (dark gray bars) with 10 mM MBCD and lysed in either TX-100 or CHAPS at 4°C. The large aggregates are derived from low-speed pellets (LSP), the medium size aggregates are from high-speed pellets (HSP) and the small aggregates are obtained from high-speed supernatants (HSS). Densitometric measurements are derived from experiments described in the Fig. 1 legend. Values on the ordinate represent the percent of the protein in each fraction. Densitometric data from the two groups of integral TJ proteins (A and B), the lipid binding proteins (C) and TJ associated cytoplasmic proteins (D). Densitometric data from cell monolayers incubated with MBCD for 30 min and extracted with either 3.25% TX-100 or 4% CHAPS (E). Densitometric data of transferrin receptor from cells treated as in (E) and extracted with either of two concentrations of TX-100 or CHAPS (F). In (D) and (E) only data from control cultures and those incubated with MBCD for 30 min are shown.

