
Figure 1. RIVET screen for late genes.
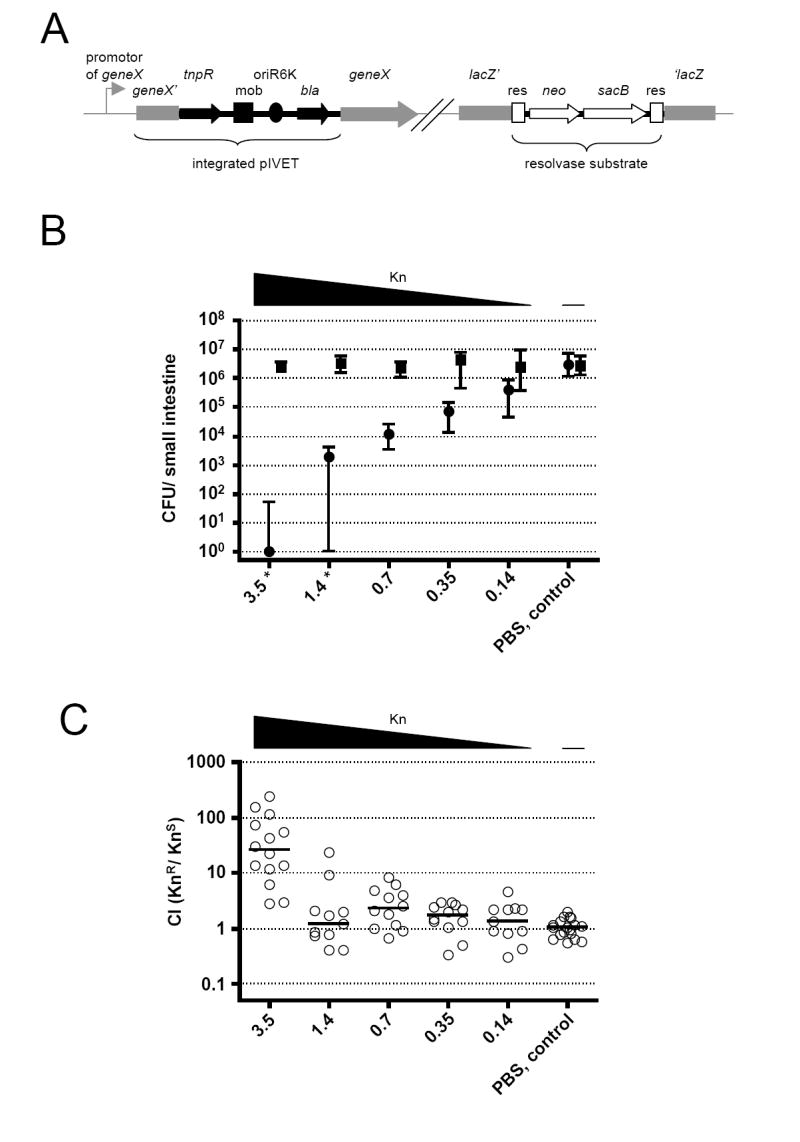
(A) Illustration of the genetic components of RIVET (Osorio et al., 2005). Chromosomal sequences are in gray, pIVET parts are in black, and the res-cassette parts are in open shapes. pIVET is integrated into V. cholerae hypothetical geneX via homologous recombination resulting in a merodiploid in which geneX and tnpR (resolvase) are transcriptionally fused and controlled by the chromosomal promotor of geneX. The mobilization (mob), origin of replication (oriR6K) and ApR (bla) regions of pIVET, as well as the gene for KnR (neo), SucS (sacB) and the target sites of resolvase (res) of the res-cassette are indicated.
(B) Shown are the medians of recovered KnR (boxes) and KnS (circles) bacteria at 24h post-infection. The different amounts of Kn given at 7h post-infection are indicated on the x-axis. ≥10 mice from three independent experiments comprise each data set. Error bars indicate interquartile ranges. There was a significant decrease in colonization for the KnS strain compared to the PBS control for Kn concentrations ≥0.35mg/kg bw (p<0.01, using a Kruskal-Wallis test and a post-hoc Dunn’s Multiple comparisons), whereas the KnR bacteria were unaffected (p>0.05, using a Kruskal-Wallis test). * The level of KnS bacteria was below detection limit of 1 CFU for some animals, but in order to plot the data the CFU/ml were set to 1.
(C) Competition indices (CI) at 24h post-infection from the small bowel of infant mice. 4h before infection mice were given orally the same concentrations of Kn used in Panel B. Each circle represents the CI from a single animal. Horizontal bars indicate the median of each data set. Only the 3.5mg/kg bw data set is significantly different from the PBS control (p<0.01, using tests in panel B legend).