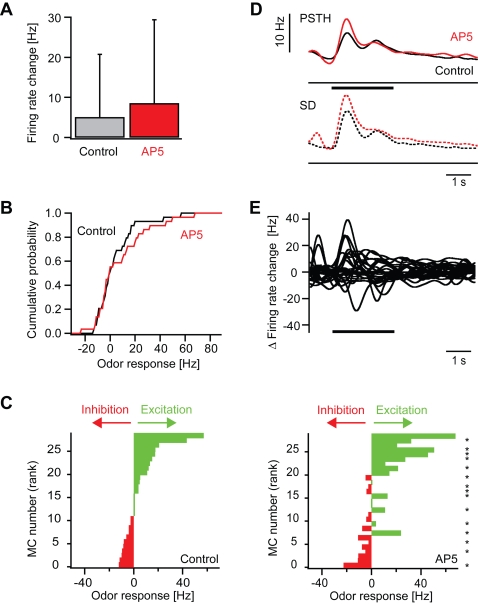
Figure 6. Effect of AP5 on odor responses of mitral cells: quantitative analysis.
(A) Mean firing rate change evoked by odor stimulation before (control) and during AP5 treatment in the time window between 0.25 and 0.75 s after response onset. (B) Cumulative distribution of odor-evoked firing rate changes in mitral cells before (control) and during application of AP5. (C) Left: mitral cell odor responses ranked according to the firing rate change measured before application of AP5. Right: Responses of the same mitral cells to the same odors in the presence of AP5 (same rank order as control). Asterisks denote responses that were significantly changed in the presence of AP5 (Student's t-test; P<0.05). (D) Top (continuous lines): average peri-stimulus time histogram of mitral cell odor responses before (control) and during application of AP5. Thick portions depict time bins where the peri-stimulus time histogram in the presence of AP5 was significantly different from the control peri-stimulus time histogram in the corresponding time bin (sign test; P<0.05). Bottom (dashed lines): standard deviation. (E) Differences of peri-stimulus time histograms (AP5–control) for all mitral cell odor responses.

