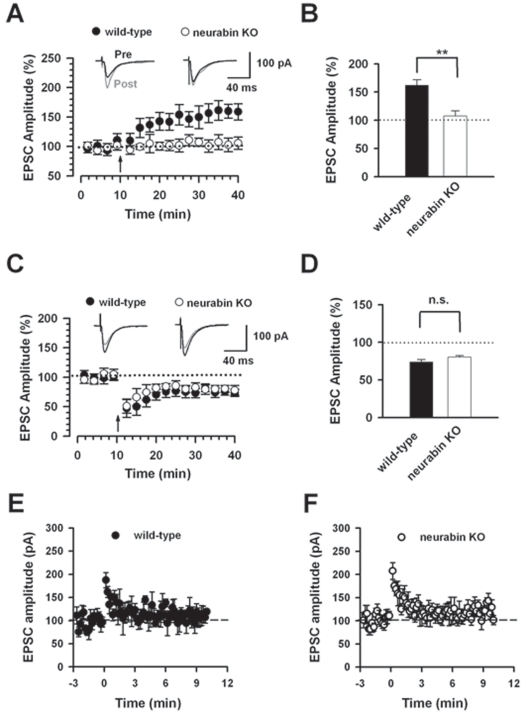
Figure 2. Reduction of hippocampal long-term potentiation but not long-term depression in neurabin KO mice.
A, LTP is induced in hippocampal CA1 neurons with paring protocol in wild-type mice (n = 6). However, no LTP was induced in CA1 neurons in neurabin KO mice (n = 6). The insets show averages of six EPSCs at baseline response (pre, dark traces) and 30 min after (post, gray traces) LTP induction (arrow). The dashed line indicates the mean basal synaptic response. B, Statistical results showed significant loss of LTP in neurabin KO mice. C, LTD is induced in hippocampal CA1 neurons with paring protocol (−45 mV, 1 Hz, 300 pulses) in wild-type mice (n = 6). Similar LTD was observed in CA1 neurons in neurabin KO mice (n = 8). The insets show averages of six EPSCs at baseline response and 30 min after LTD induction (arrow). The dashed line indicates the mean basal synaptic response. D, Statistical results showed no significant difference (n.s.) in LTD between wild-type mice and neurabin KO mice. E, Post-tetanic potentiation is induced by stimulation of 100 Hz, 1s in wild-type mice (n = 9). F, Same stimulation protocol as E induced similar post-tetanic potentiation in neurabin KO mice (n = 12).

