
Figure 2.
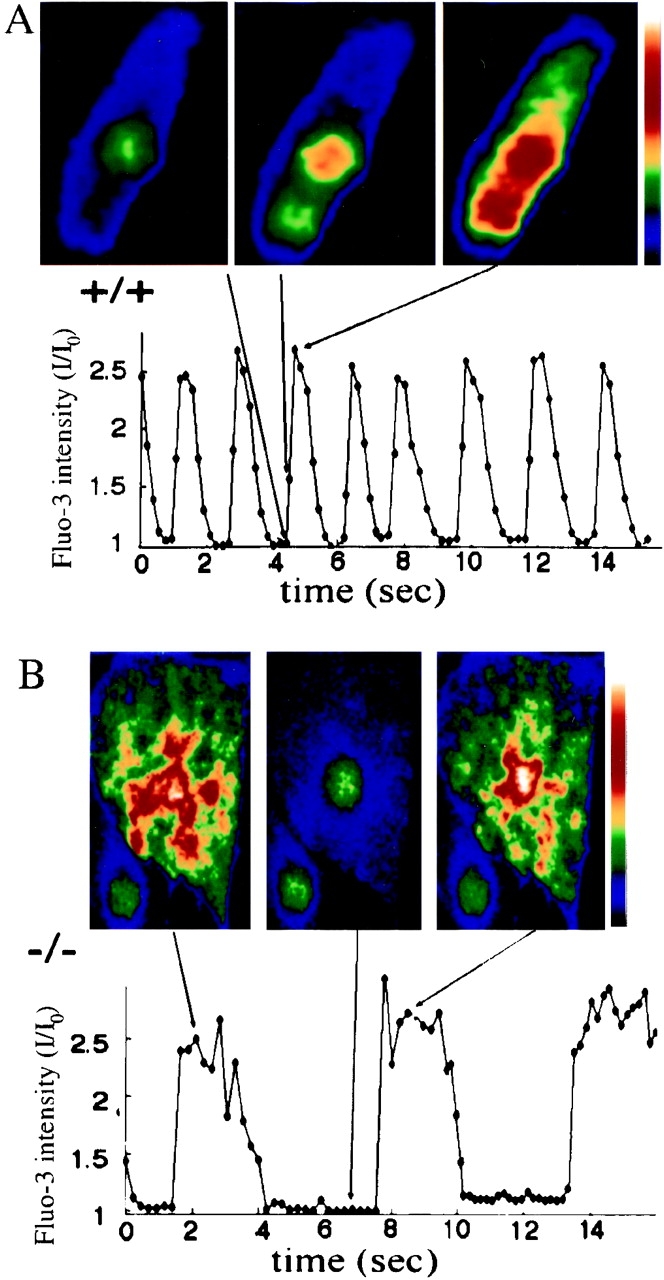
Abnormal spatial and temporal patterns of intracellular calcium release during spontaneous contractions of ankyrin-B (−/−) neonatal cardiomyocytes. Cytosolic Ca2+ levels were measured as a function of time (A and B, bottom) in cultured neonatal cardiomyocytes of littermate ankyrin-B (+/+) (A) and ankyrin-B (−/−) mice (B) using Fluo-3 as a calcium indicator (see Materials and Methods). Top panels of A and B show images of intracellular Ca2+ levels in cells at times indicated by lines, where the color scale on the right shows pseudocolored Ca2+ intensity levels, increasing from black (low Ca2+) to white (high Ca2+). Note that the ankyrin B (−/−) cardiomyocyte shows several distinct foci of increased Ca2+ levels during Ca2+ release (B, top left and right).