
Figure 2.
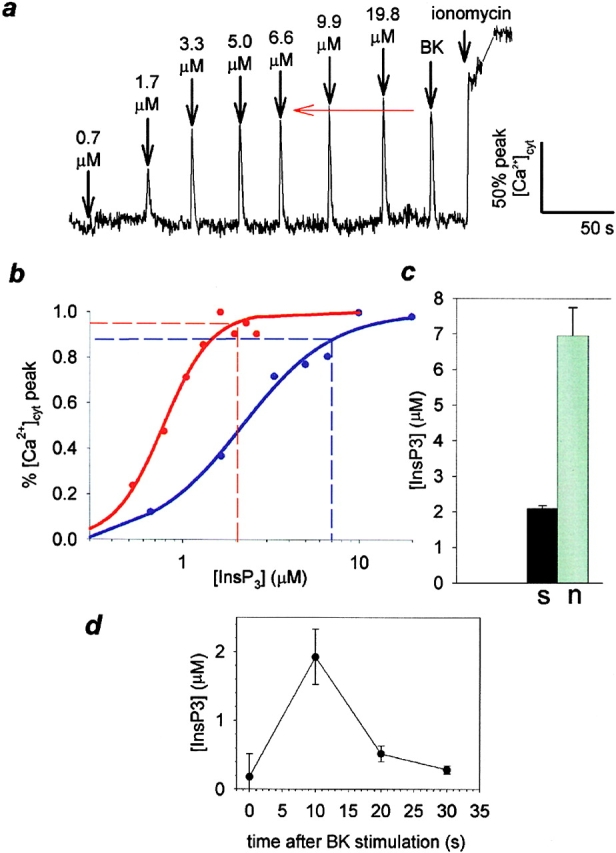
Measurement of [InsP3]cyt. a, Cells were microinjected with CG-1 and NPE-InsP3, and CG-1 fluorescence was measured on the confocal microscope. Fluorescence intensity values were converted to relative [Ca2+] and plotted against time. The cell was subjected, in turn, to increasing doses of InsP3 released by UV light flashes of 20–80 ms, 500 nM BK application to the medium, and treatment with 10 μM ionomycin. A typical experiment, in which the neurite signal is followed, is shown here. The gray line connecting the tracing after addition of ionomycin indicates a period during which the cell was refocused. b, For two cells where neurite (blue) and soma (red) are monitored, relative peak [Ca2+] for each uncaging event has been plotted against [InsP3]uncaged (solid circles). The data has been fit (solid curve) with the Hill equation (R = 0.99). A dashed horizontal line was drawn indicating the [Ca2+]cyt response produced by BK stimulation in each region. A corresponding pair of lines were dropped from the Hill equation curve, indicating the [InsP3] necessary to produce the BK-induced calcium peak. c, Mean values (± SEM) of estimated InsP3 production by BK in soma (black) and neurite (gray) are compared in a bar graph (P < 0.001). d, [InsP3]cyt was measured in a N1E-115 neuroblastoma cell population during a BK-induced calcium wave using competitive radioligand binding.