
Figure 3.
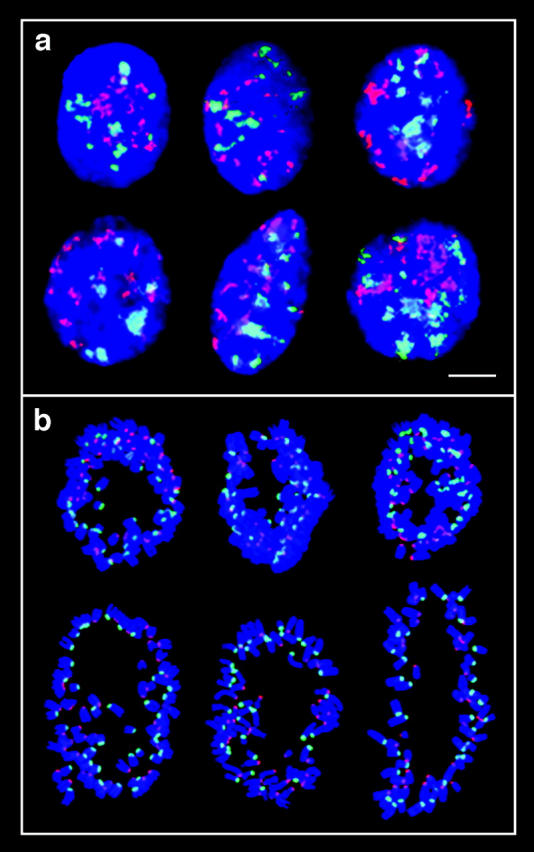
Distribution of paternal (green) and maternal (red) centromeres in somatic cells of MMU × MSP hybrid animal. a, Peritoneal fibroblast nuclei (>500) displaying spatial separation of paternal and maternal heterochromatin blocks. Numbers in parentheses indicate the number of cells analyzed. Bar, 10 μm. b, Random distribution of MMU and MSP chromosomes around representative prometaphase rosettes (>50).