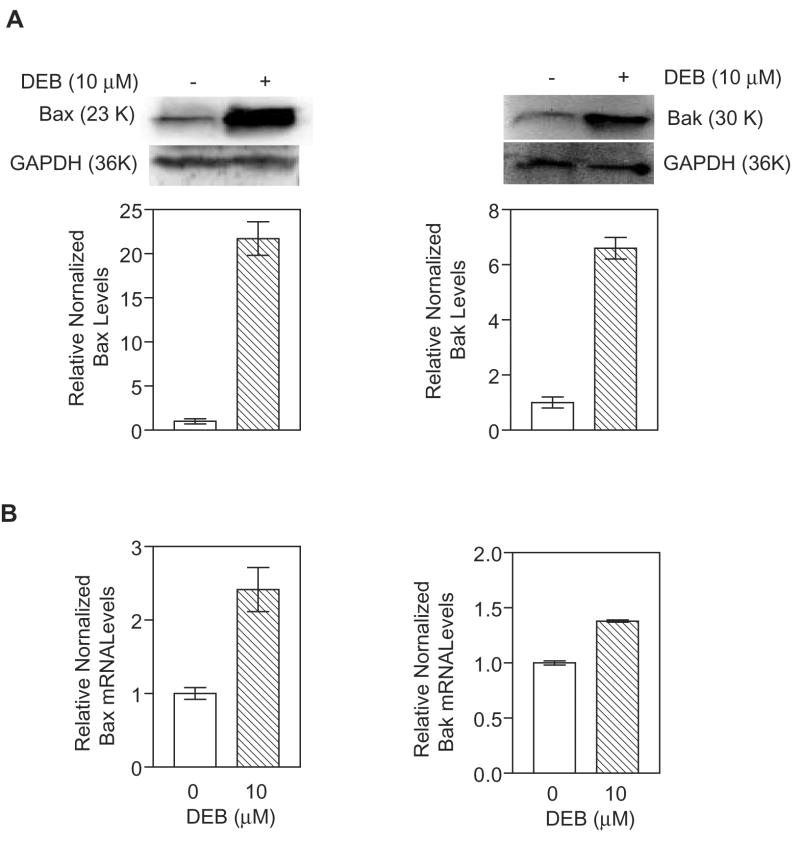
Figure 1. Bax and Bak protein and mRNA levels in TK6 cells undergoing DEB-induced apoptosis.
A. Protein Levels. Extracts (100 μg of protein) from cells exposed to vehicle and 10 μM DEB for 24 h were subjected to western blot analysis. Relative normalized levels shown in graphical representations for Bax (left panel) and Bak (right panel) were obtained after densitometer tracing, followed by normalization to the corresponding GAPDH levels for each sample. Representatives of three experiments are shown. B. Messenger RNA Levels. Total RNA extracted from control and TK6 cells exposed to 10 μM DEB for 24 h was subjected to quantitative real-time reverse-transcriptase polymerase chain reaction using Bax (left panel) and Bak (right panel) gene specific primers. The results obtained were normalized against GAPDH levels in the same samples, and the numbers obtained for exposed cells were compared to control un-exposed cells using a computer program for relative quantitation.

