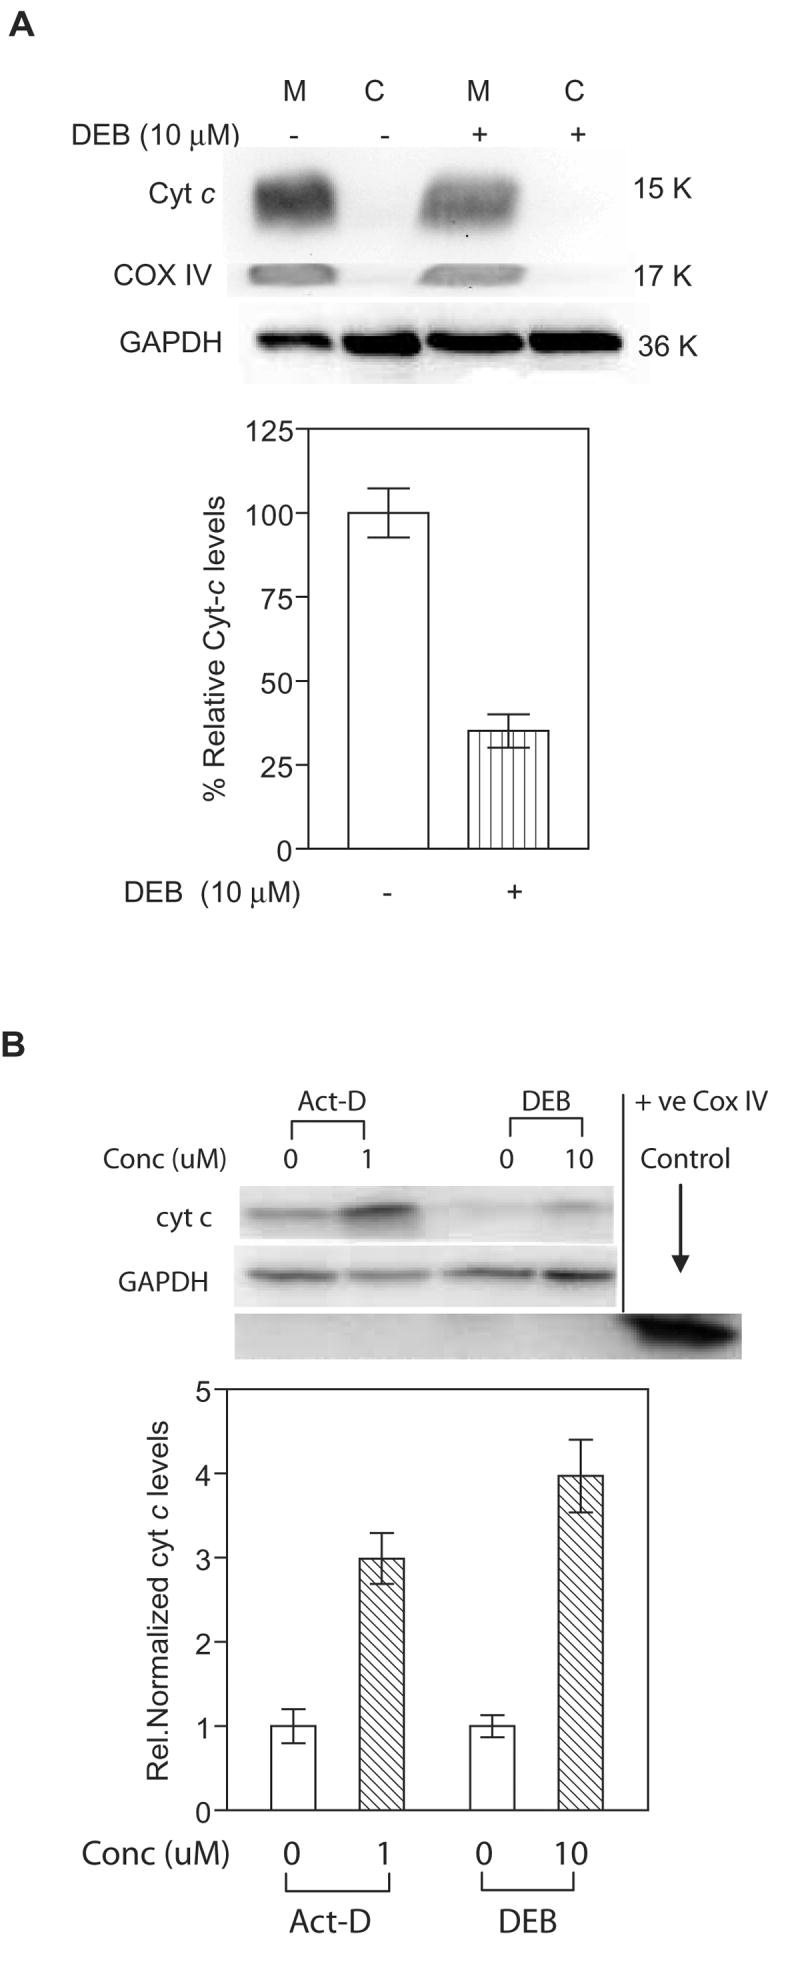
Figure 5. DEB affects the distribution of cytochrome c levels in exposed cells.

Mitochondrial (M) and cytosolic (C) fractions from control and DEB-exposed cells were analyzed for cytochrome c (using 7H8.2C12 antibody), mitochondrial marker COX IV, and GAPDH levels by western blot analysis. The experiments were repeated three times, and representative western blot data as well as the corresponding bar graph of the relative normalized cytochrome c levels are shown. A. TK6 cells exposed to 10 μM DEB for 14 h. Western blot data (top panel) obtained from mitochondria and cytosolic fractions, as well as the graphic representation (bottom panel) of mitochondrial cytochrome c levels in control and DEB-exposed TK6 cells are shown. Percent relative cytochrome c (Cyt-c) levels were obtained by normalizing against COX IV levels in the same fraction, and expressing this value as a percentage of Cyt-c levels in the mitochondria of control unexposed cells. Since no cytochrome c was detected in cytosolic fractions of TK6 cells under our experimental conditions, only mitochondrial Cyt-c values in control and exposed cells are compared (bottom panel). B. Jurkat cells exposed to 1 uM Actinomycin D and 10 μM DEB for 17 h. Western blot data (top panel) as well as the graphic representation (bottom panel) of cytochrome c levels in the cytosolic fractions of control and exposed cells are shown. Relative normalized cytochrome c (Cyt-c) levels were obtained by normalizing against GAPDH levels in the same sample, and further normalizing the obtained values against the corresponding control un-exposed cell values.
