FIG. 4.
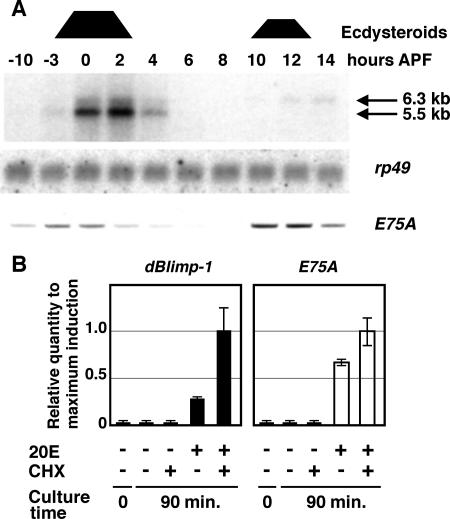
Characterization of dBlimp-1 transcripts. (A) Detection of dBlimp-1 mRNA by Northern blotting using staged total RNA at the onset of metamorphosis. High-ecdysone periods are indicated at the top by trapezoids. Positions of dBlimp-1 mRNA are indicated by arrows. Middle panel, detection of rp49 mRNA using the same membrane. Bottom panel, level of E75A transcript detected by RT-PCR using the same staged RNA. (B) Induction of dBlimp-1 (left) and E75A (right) mRNAs by 20E in cultured salivary glands. Expression levels were measured by quantitative real-time RT-PCR using total RNA from salivary glands cultured for 90 min in the presence of 20E and/or cycloheximide (CHX). The value for each transcript was normalized to that of rp49 transcripts, with the level obtained with 20E and cycloheximide set as 1 for each transcript. The same template was used to measure the amounts of dBlimp-1 and E75A mRNA. Error bars indicate standard deviations.

