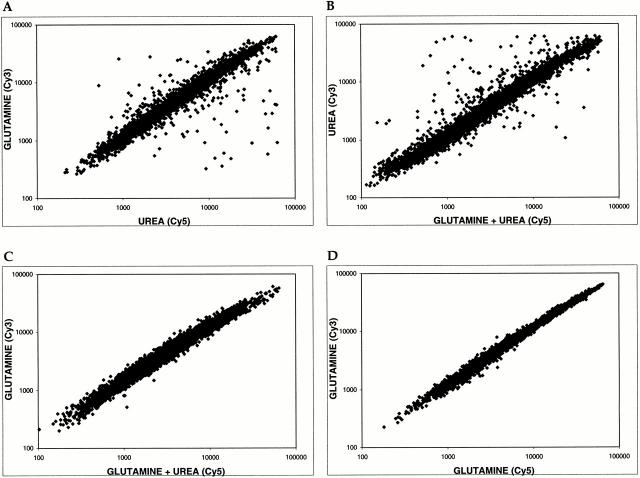
Figure 2.
Glutamine is both a global activator and repressor of gene expression. Scatter plots show pairwise comparisons of gene expression profiles of S288c cells grown in the presence of glutamine, urea, or glutamine + urea. (A) MD-glutamine versus MD-urea. (B) MD-urea versus MD-glutamine + urea. (C) MD-glutamine versus MD-glutamine + urea. (D) Control experiment comparing MD-glutamine with itself. For each plot, the x axis depicts cDNA samples labeled with Cy5 dye and the y axis depicts samples labeled with Cy3 dye.

