Figure 3.
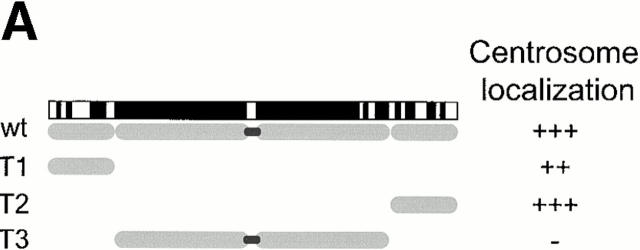
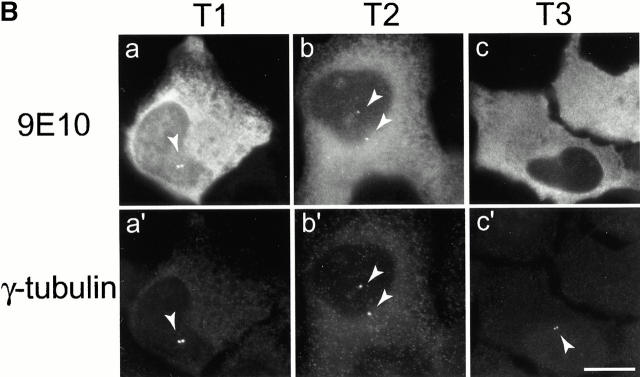
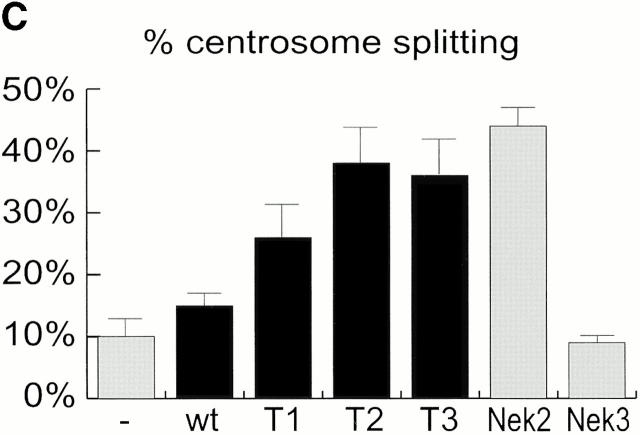
Mutational domain analysis of C-Nap1. (A) Schematic view of C-Nap1 domain structure and different C-Nap1 deletion mutant constructs. The dark gray boxes designate the predicted coiled-coil domains in C-Nap1. A semiquantitative assessment of the ability of C-Nap1 mutants to localize to centrosomes is given as follows: −, no centrosomal signal; ++, the ability to localize to centrosomes in ∼2/3 of transfected cells; +++, centrosome association in all transfected cells. (B) Illustration of the phenotypes observed after overexpression of three different C-Nap1 deletion mutants: T1 (a and a′), T2 (b and b′), and T3 (c and c′). U2OS cells were analyzed by double immunofluorescence microscopy, by using anti-myc (9E10) mAb to visualize C-Nap1 deletion mutants (a–c) and anti–γ-tubulin (a′–c′). Arrowheads mark the positions of centrosomes. Bar, 10 μm. (C) Overexpression of C-Nap1 deletion mutants induces centrosome splitting. The histogram indicates the percent of transfected cells with split centrosomes. Cells transfected with the full-length C-Nap1 (wt) as well as nontransfected cells (−) are shown for control, and the extent of splitting observed with the protein kinases Nek2 and Nek3 is shown for comparison. A myc tag was present in all constructs. Errors bars indicate standard deviations for data collected from three independent experiments.


