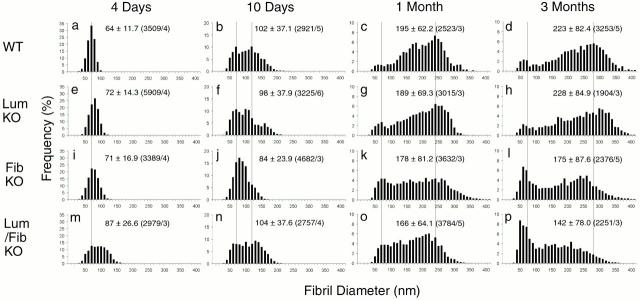
Figure 6.
Collagen fibril diameter distributions during development of wild-type, lumican-null, fibromodulin-null, and double lumican/fibromodulin–null tendons. Collagen fibril diameter distributions are presented as histograms for wild-type (a–d), lumican-deficient (e–h), fibromodulin-deficient (i–l), and double lumican/fibromodulin–deficient (m–p) mouse tendons. Vertical dotted lines indicate peaks observed in wild-type mouse tendons at ∼65, 120, 240, and 280 nm. (a–d) Means, SD, and number of fibrils measured (n)/number of different animals (n a) are presented as mean ± SD (n/n a) in the graphs.

