
Figure 2.
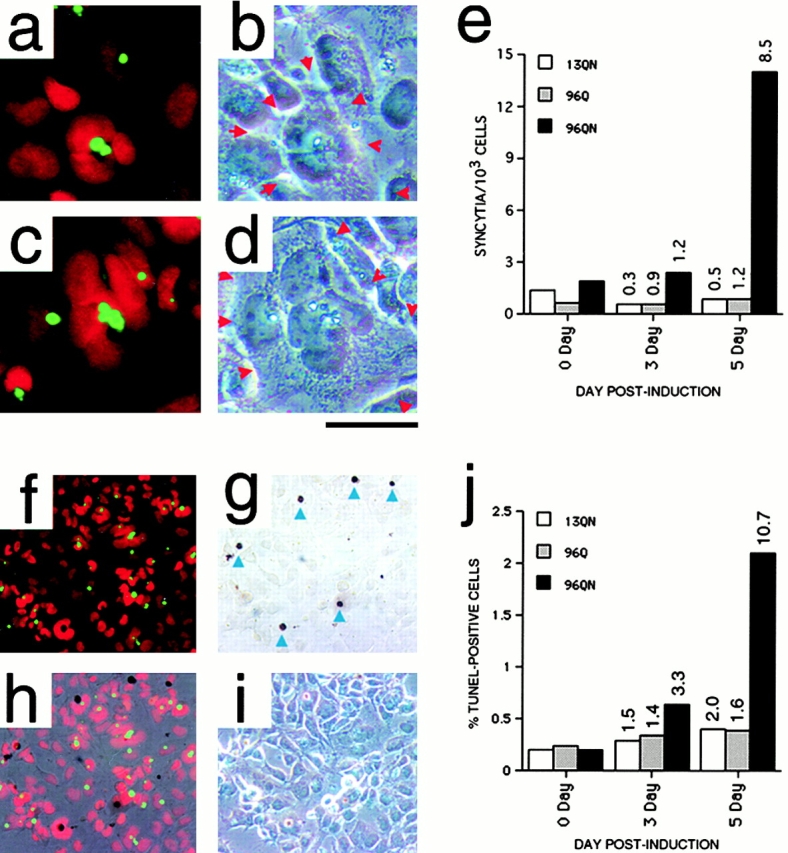
Morphological changes and cell death in induced polyQ-expressing cells. (a–d) 5-d induced 96QN cells matched fluorescence (a and c) and phase–contrast images (b and d), revealing multinucleated syncitia-like cell structures. In a and c, nuclei are red, and polyQ–GFP IAs are green. In b and d, red arrowheads indicate the syncitia boundaries. (e) Quantification of the number of syncitia-like structures/103 cells in a typical experiment in each induced cell population at 0, 3, and 5 d. Numbers indicate fold change relative to day 0. (f–i) TUNEL positivity in induced 96QN cells. (f) Fluorescent view; (g) bright-field view reveling DAB-stained TUNEL-positive profiles; (h) overlay of both views; and (i) corresponding phase–contrast view. Arrows in panel g indicate TUNEL profiles that were scored as positive for quantification. Overlay and phase–contrast views reveal that the TUNEL positive cells are often rounded up and resting just above the monolayer of surviving cells below. (j) Quantification of the number of TUNEL-positive profiles in a typical experiment in each induced cell population at 0, 3, and 5 d. Numbers indicate fold change relative to day 0. The slight increase in apoptotic cells at 3 and 5 d for 13QN and 96Q cells is probably the consequence of high cell density near the end of the culture period. Bar: (a–d) 50 μm; (f–i) 250 μm.