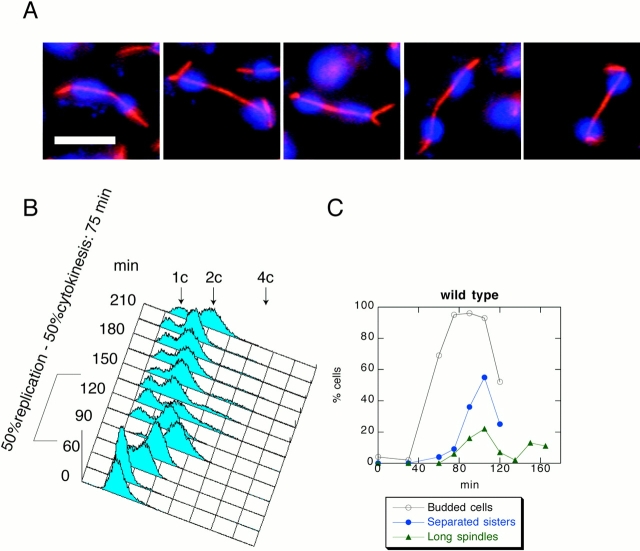
Figure 1.
The control G1 cells released at 34°C. (A) Photomicrographs taken 105 min after release. Microtubules were detected by indirect immunofluorescence and are shown in red. DNA was visualized by DAPI and shown in blue. (B) FACS® profile shows that for these cells the time between DNA replication and cytokinesis is ∼75 min. (C) Sister chromatids separate 30 min after budding. 22% of the cells have long spindles in anaphase. Bar, 5 μm.

