
Figure 4.
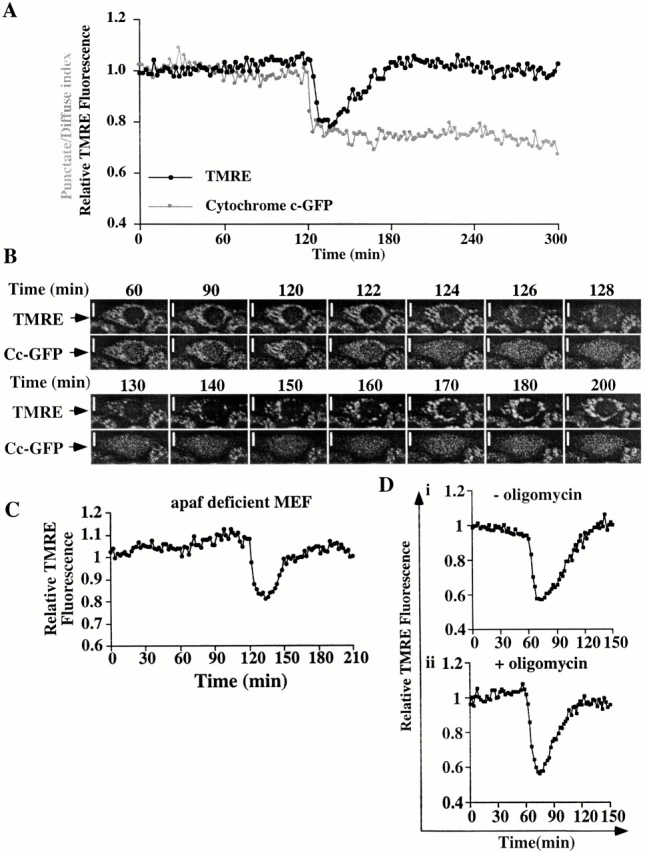
Dissipation and regeneration of ΔΨm after cytochrome c release in the absence of caspases. (A) Time lapse of the relative brightness of TMRE and the punctate–diffuse index of cytochrome c–GFP in one Cc-GFP-HeLa cell treated with actinomycin D (1 μM) in the presence of zVADfmk showing a drop in ΔΨm, followed by a slow regeneration of ΔΨm after cytochrome c–GFP release. Cytochrome c–GFP release was set at 120 min. (B) Pictographic representation of ΔΨm and cytochrome c–GFP in the cell depicted in A shows that ΔΨm is regenerated, whereas cytochrome c–GFP remains diffuse throughout the cell. More cells can be seen in Quicktime movie format at http://www.jcb.org/cgi/content/full/153/2/319/DC1. In the movie, green (left) indicates cytochrome c–GFP, whereas red (right) indicates TMRE staining. (C and D) Time-lapse of the relative brightness of TMRE fluorescence of one Apaf-1–deficient murine embryonic fibroblast (apaf-deficient MEF) treated with 1 μM actinomycin D (C), one Cc-GFP-HeLa cell treated with 1 μM staurosporine in the presence of 100 μM zVADfmk (Di), or one Cc-GFP-HeLa cell treated with 1 μM staurosporine in the presence of 100 μM zVADfmk and 10 μg/ml of oligomycin (Dii). Bars, 10 μm.