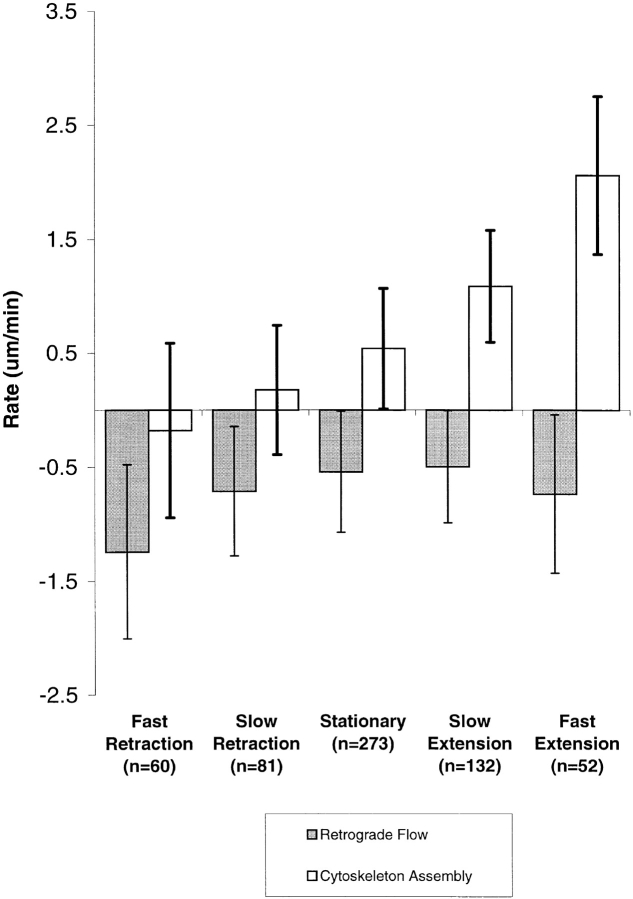
Figure 5.
Average assembly and flow rates grouped by rates of filopodium movement. Tip movement, assembly, and flow rates were determined for individual bouts of filopodia movement for all observations, and arbitrarily grouped on the basis of tip movement as follows. Rapidly retracting: retracting at greater than −1 μm/min. Slowly retracting: between −1 and −0.3 μm/min. Stationary: between −0.3 and +0.3 μm/min. Slowly extending: between +0.3 and +1 μm/min. Rapidly extending: extending at any rate above +1 μm/min. Error bars are SD of the mean values in each group. For analysis, the rates of tip movement, assembly, and flow were measured between each time point (every 30 s) for each filopodium and grouped. Different periods of movement of a single filopodium might contribute to several different categories. The plot pools 587 individual time point measurements taken from 75 separate filopodia from 18 different sequences. 14 were Q-rhodamine photoactivation experiments and 4 were GFP-photobleaching experiments. We were unable to detect differences between these two groups of data examined separately.

