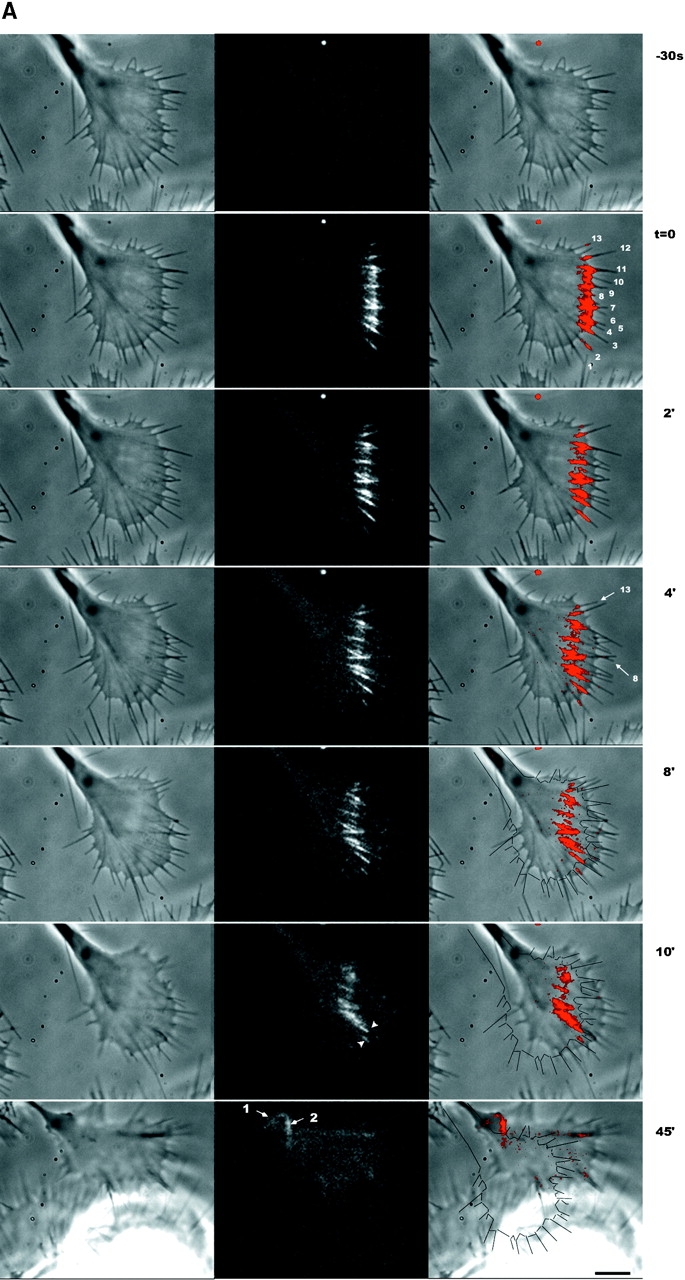
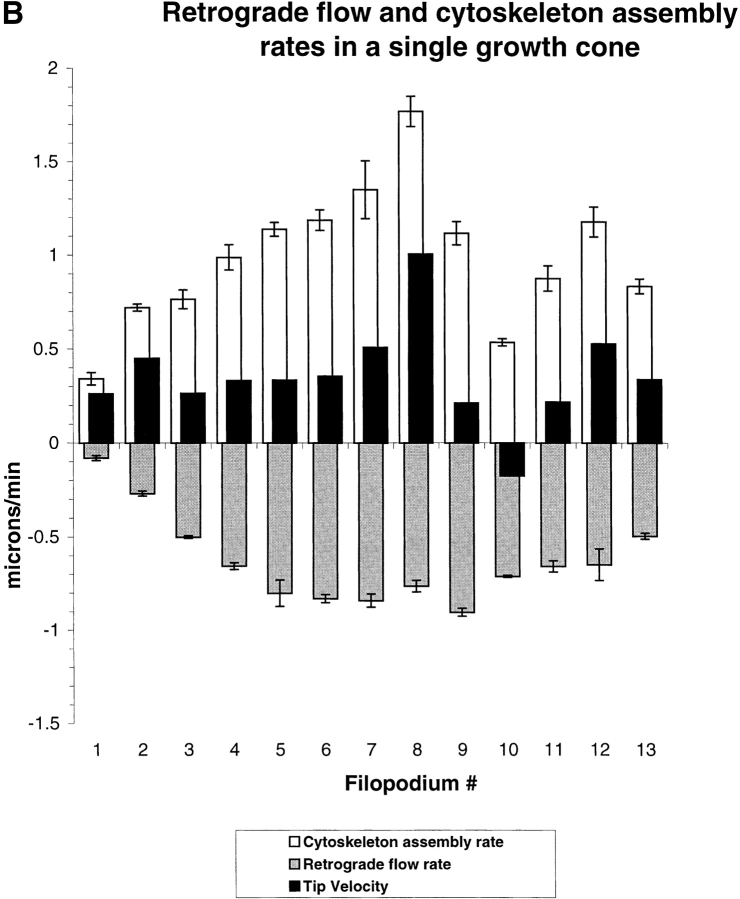
Figure 6.
Actin dynamics vary between filopodia in a single growth cone. By following photoactivation marks on multiple filopodia in single growth cones we measured spatial variation in dynamics parameters. (A) Phase-contrast (left), fluorescence (middle), and combined (right) images. The outline of the growth cone at t = 0 are drawn on the combined image at 8–45 min. Photoactivation marks were made at t = − 0.3 min and again at t = 15 min. Arrows in t = 45 min indicate the remaining zones of marked actin from the first (1) and second (2) marking. Note that marks made near the top of the growth cone flow backward faster than marks made near the bottom. Arrowheads at 10 min indicate a zone of slow relatively slow flow. A typical feature of long sequences, apparent here, is the coalescing of filopodium actin bundles as they flow toward the neck of the growth cone. At t = 45 min, actin filaments marked at the tip are still visible and have been transported to the neck of the growth cone where they undergo lateral compression. From this sequence, we tracked mark and tip movements for 13 individual filopodia (indicated with numbers at t = 0, right column) over the course of 10 min and determined average assembly and flow rates by linear regression. (B) Average tip movement (black bars), assembly (white bars), and flow (gray bars) rates for the individual filopodia numbered as in A. Error bars indicate the SD of the regression coefficients, a measure dominated by temporal variation in dynamics. Bar, 5 μM.


