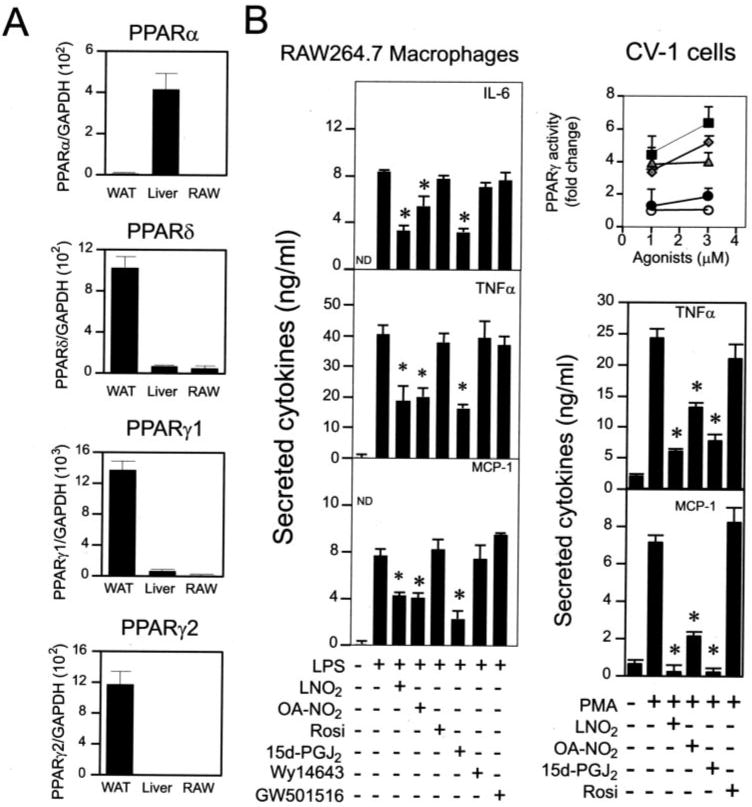
FIGURE 3. Nitrated fatty acids inhibit secretion of proinflammatory cytokines in macrophages via PPARγ-independent pathways.

A, relative expression levels of PPARs in RAW264.7 cells. Expression of PPARs was analyzed by real time PCR. Expression of PPARs in WAT and liver was used as positive control. B, comparison of PPAR ligands and nitrated lipids on the induced secretion of proinflammatory cytokines in RAW264.7 cells. Inset, the activity of PPARγ induced by various PPARγ ligands was measured using a CV-1 reporter assay (■, OA-NO2; ◆, LNO2; ▲, rosiglitazone (Rosi); ●, 15d-PGJ2; ○, vehicle). Proinflammatory cytokine production was measured by ELISA. The concentrations used in B were: LPS, 1 μg/ml; PMA, 0.1 μm; OA-NO2, 2.5 μm; LNO2, 2.5 μm; Rosiglitazone, 3 μm; 15d-PGJ2, 3 μm; GW501516, 0.5 μm; Wy14643, 100 μm. Values are expressed as mean ± S.D. (n = 6). *, p < 0.05 versus LPS alone. WAT, white adipose tissue of C57BL/6J mice; Liver, liver of C57BL/6J mice.
