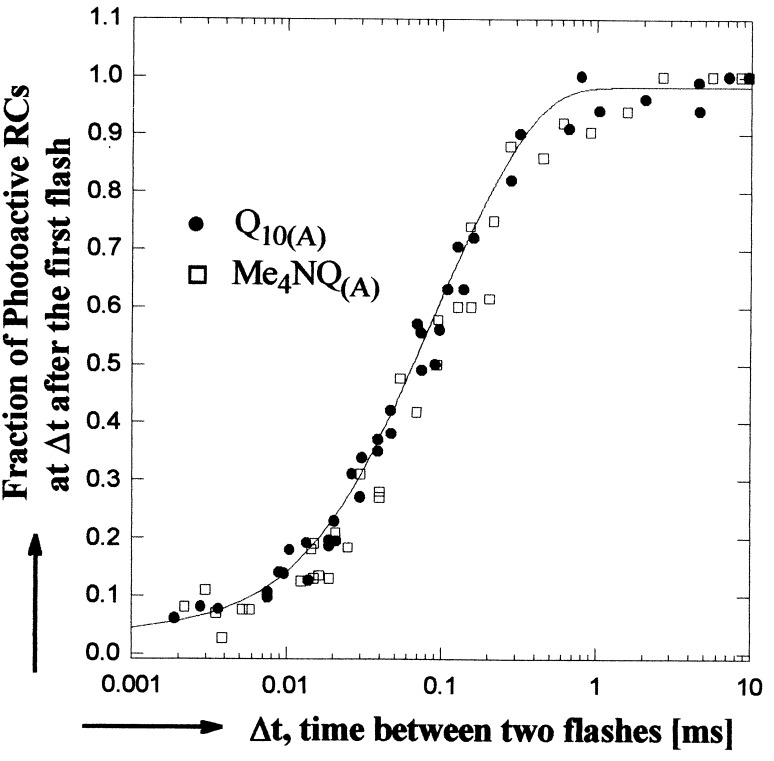
Figure 3.
The fraction of photoactive RCs as a function of the time interval between two laser flashes for native (•), and hybrid (□) RCs. The solid line represents a least squares biexponential fit to the data. A minimum of 20 min dark recovery was allowed between sets of flashes. (865 nm assay conditions given in Fig. 2; at 550 nm, cyt c22+ concentration was reduced to ≈30 μM; spectral bandwidth, 4 nm.)

