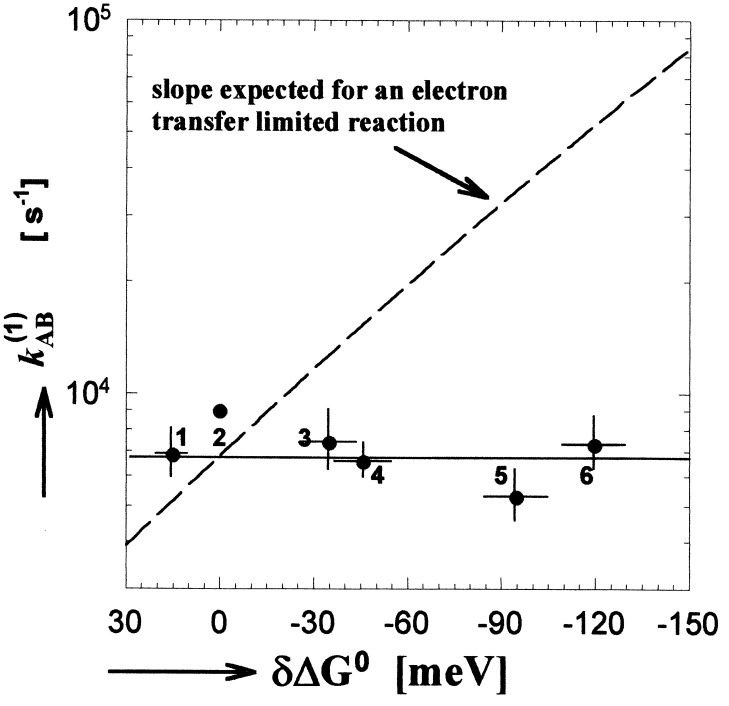
Figure 4.
The electron transfer rate kAB(1) as a function of redox free energy (driving force) for electron transfer (data from the second and seventh columns of Table 1). The solid line gives a best fit to the data. The dashed line represents the dependence predicted by the Marcus theory for an electron transfer limited reaction using the measured free energy difference between the initial, QA−⋅QB, and final, QAQB−⋅, states of 60 meV (19) and 1.1 eV for the reorganization energy (13, 31). Error bars represent one SD of the mean. Quinones incorporated into the QA site listed in order of decreasing redox potential were: 1, MQ0; 2, Q10; 3, MQP; 4, MQ4; 5, Me3NQ; and 6, Me4NQ. Redox energies are quoted with respect to Q10 (see • without error bars).

