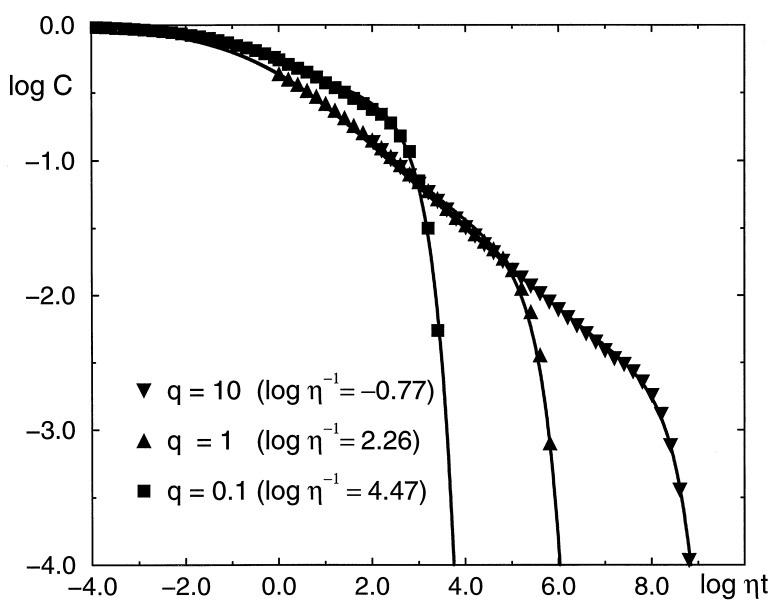
Figure 4.
Fit of the computer simulation results obtained for the cluster of the 12th order and various values of the ratio q (cf. Fig. 3) to the combined analytical Eqs. 11 and 14. The fitted curves are plotted as continuous lines, and the simulation data, intentionally diluted for clarity, are represented by points. Not involved in the fitting procedure the fixed values of α = 0.317 and of logκ−1 = 7.60 were assumed. The former follows from the relation 13, and the latter were estimated in independent simulations. The fit resulted in the values of a = 0.196, 0.00778, and 0.00102 for q = 0.1, 1, and 10, respectively, and the values of logη−1 that are quoted directly in the figure. Here, unlike in Fig. 3, time is measured in units of η−1.

