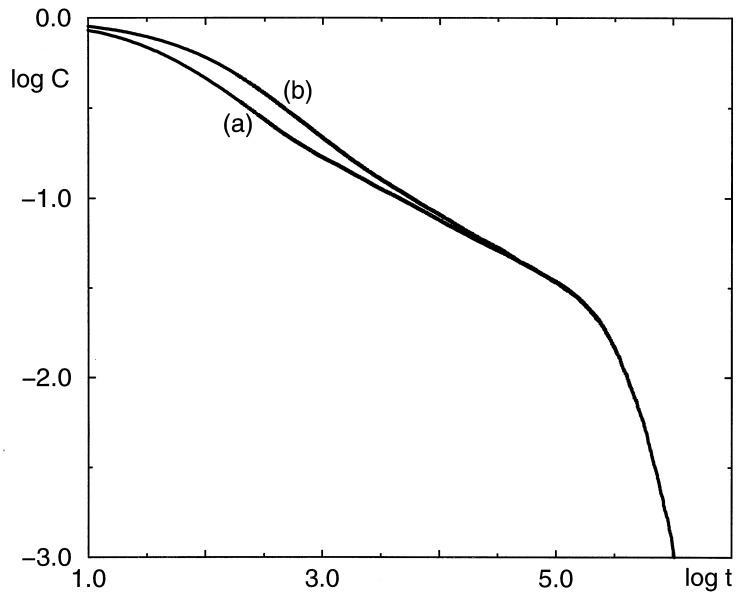
Figure 5.
Log–log plot of the time courses of the survival probability obtained in computer simulations of random walk on the Sierpiński gasket limited to the cluster of the 9th order and for all walkers starting from a set of 33 = 27 sites, each at the beginning occupied with the same probability equal to 1/27, and composing simultaneously the gate to exit the lattice. The value of the ratio q = 0.1 was assumed for all gate sites. Time is measured by the number of steps in which transitions were randomly generated. Curve a is for the gate preserving the self-similarity symmetry of the lattice. Starting from the value logt = 3, this curve is practically identical to that obtained for the cluster of the 6th order in the presence of the single site gate, translated by ∼2.05 logarithmic units (cf. Fig. 3, curves for r = 6 and 9) and, thus, for the effective value of q ≈ 102.05 × 0.1 ≈ 11.2. Curve b is for the gate colinearly extended to the maximum. Note a larger value of the exponent α also in the power-law stage of the reaction.

