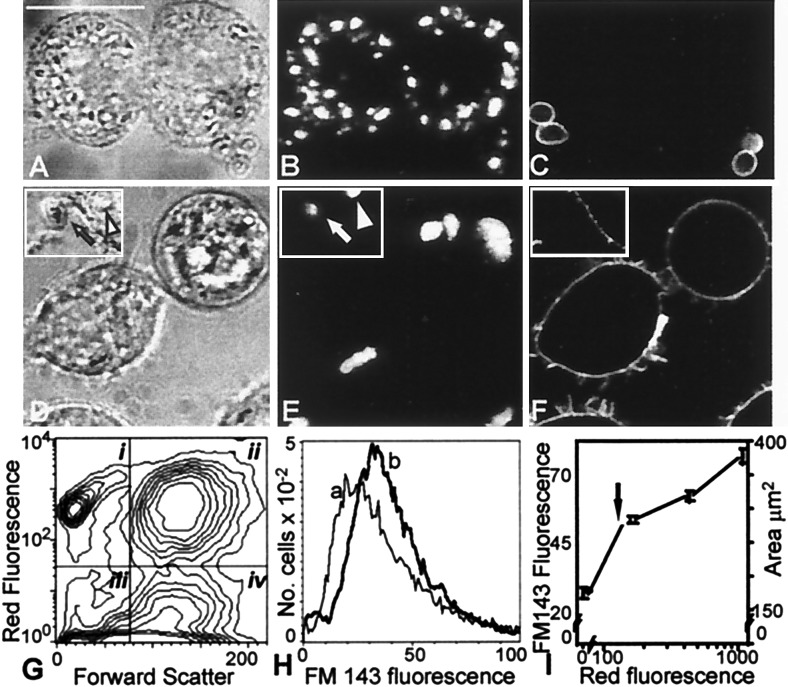
Figure 1.
Changes in macrophage surface area after phagocytosis of OPZ. (A–C) J774 cells were allowed to interact with biotinylated, Texas red-labeled OPZ. Extracellular particles were identified by treatment with avidin-FITC. (A) Bright field (Nomarski) image. Bar, 10 μm. (B) Red fluorescence (Texas red emission) of cells in A as analyzed by confocal fluorescence microscopy, indicating the location of OPZ. (C) Green fluorescence (avidin-FITC emission) of cells in A, identifying extracellular OPZ. (D–F) J774 cells were allowed to internalize Texas red-labeled OPZ as in A, treated with the dye FM-143 at 4°C (which provides a measure of the surface membrane), and then examined by confocal microscopy. (D) Bright field image; inset shows an extracellular particle (arrow) and an intracellular particle (arrowhead). (E) Red (Texas red) fluorescence of cells in D indicating the location of OPZ. (F) Green (FM-143) fluorescence indicating surface labeling of cell only. (G) Analysis of association of OPZ with J774 cells by flow cytometry. The arbitrarily designated quadrants define the following populations: i, extracellular OPZ; ii, macrophages with associated OPZ; iii, debris; and iv, macrophages not associated with OPZ. (H) Frequency histogram of the fluorescence intensity of cell-associated FM-143, a measure of cell surface area. The lighter line (a) corresponds to cells in quadrant iv in G, which had no associated OPZ. The heavy line (b) corresponds to cells in quadrant ii in G, which had internalized OPZ. (I) Correlation between Texas red fluorescence (abscissa), which is proportional to the number of OPZ particles (fluorescence equivalent to one internalized particle shown by arrow) and the uptake of FM-143 (left ordinate), which is proportional to surface area (calculated from the volume of cells, assuming a smooth spherical surface; right ordinate). Data from five separate experiments.

