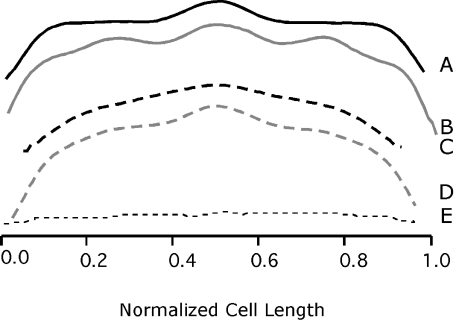
Fig. 2.
Fluorescence intensity profiles of LMC500 cells grown at 28°C in TY (A and B) or in GB1 (C and D) and immunolabelled with anti-MurG. The average normalized cell length is given on the x-axis. The average normalized fluorescence intensity (AU) is reflected on the y-axis. Fluorescence intensity was determined in cells (n ≥ 500) that have no visible constriction (A and C) and in constricting cells (B and D). To indicate the background fluorescence (unspecific binding of secondary antibody), the immunolabelling procedure was carried out with LMC500 cells where the incubation with the first antibody (anti-MurG) was omitted (E). Profiles were measured using Object-image as described in Experimental procedures.

